- Used for an overall feel for the valuation of US stocks.
- The best single measure of where valuations stand at any given moment.
Calculation =
total market capitalization of all U.S. stocks
divided by
the latest gross domestic product (GDP).
#### Levels
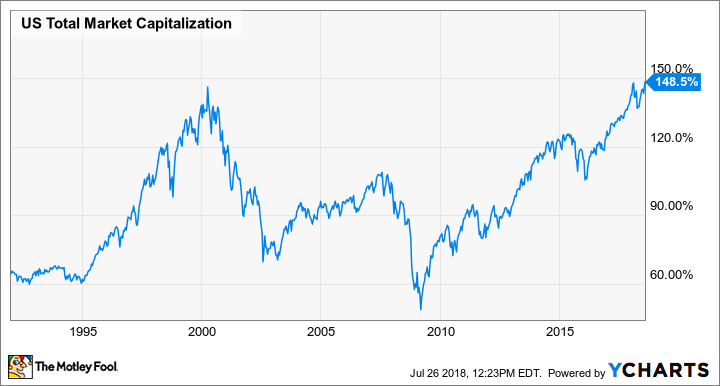
- Peaks during hot stock markets & bottoms during weak markets.
- Before dot-com bubble burst = peaked at about 145%
- Before the financial crisis = 110%
### Caveats
1. Just because the Buffett Indicator *signals that stocks are cheap doesn't mean that they won't get even cheaper. *
2. Conversely, just because the Buffett Indicator looks e*xpensive (like it does now) doesn't mean that stocks can't continue to muscle higher.*
3. Flaws that it does not account for:
- new, lower corporate [tax rate](https://www.fool.com/taxes/2017/12/29/your-complete-guide-to-the-2018-tax-changes.aspx),
- the generally business-friendly administration,
- a prolonged period of historically low interest rates,
- low unemployment,
- high consumer confidence, and
- soaring corporate earnings
4. Stock markets differential behaviour in a high vs low interest period
#### Latest on the indicator
- Never been higher at 149%
> Stocks have never been valued as high as they are now in terms of market cap to GDP.
> Start thinking defensively as the tides will turn. Keep Cash for when you need to deploy it for a market correction.
---
Source: [Motley Fool](https://www.fool.com/investing/2018/07/27/this-favorite-warren-buffett-metric-tells-us-a-sto.aspx)