While considering an Earth Observation product, a set of parameters can be defined that will distinguish the capacities provided by different EO satellite systems. The choice must then be done based on the EO User needs. The aim of this section is to provide basic keys to understanding these parameters, in order to facilitate the EO product ordering decision process.
### 1 Spatial Resolution
The spatial resolution of an image is one of the key parameters as it relates to the level of detail that can be retrieved from a scene. Image resolution can be measured in several ways; one of the most common, the **Ground Sample Distance **(GSD), is the distance between adjacent pixel centres measured on the ground. The lower this number is, the finer the detail that can be interpreted from the image.
It’s commonly considered that low resolution images have a GSD larger than 300 m. Medium resolution is between 300 m and 30 m, high resolution from 30 to 5 m and very high resolution (VHR) below 5 m. Following the performances of the recently launched commercial satellites, a new “very very high" resolution category could be distinguished for resolutions below 1 m. The best commercially available imagery has 30 cm spatial resolution (see Figure 13 for an example).
Spatial resolution selection is mainly driven by the envisaged application for the EO product. High resolution images will be required for instance to collect data for high precision agriculture, while lower resolutions are enough for applications such as weather forecasting, study of regional vegetation coverage or wide-area weather and cloud patterns.
Another factor influencing this choice is the **size of the scene to observe**. High-resolution imagery is more expensive and produces files of large size. High resolution is generally used for areas of interest smaller than 100 square kilometres.

**Figure 13:** Example of image with 30cm spatial resolution (Source: Digital Globe [http://microsites.digitalglobe.com/30cm/](http://microsites.digitalglobe.com/30cm/))
The National Imagery Interpretability Rating Scale (NIIRS) is used as a standard to quantify the interpretability or usefulness of an image. This "rating" scale, originally inspired by the military to qualify aerial imaging, runs from 0 (worst quality) to 9 (best quality). An excerpt is presented in Figure 14, which also provides an approximate relation between NIIRS scale and GSD (GSD being one of several factors influencing the interpretability of an image).
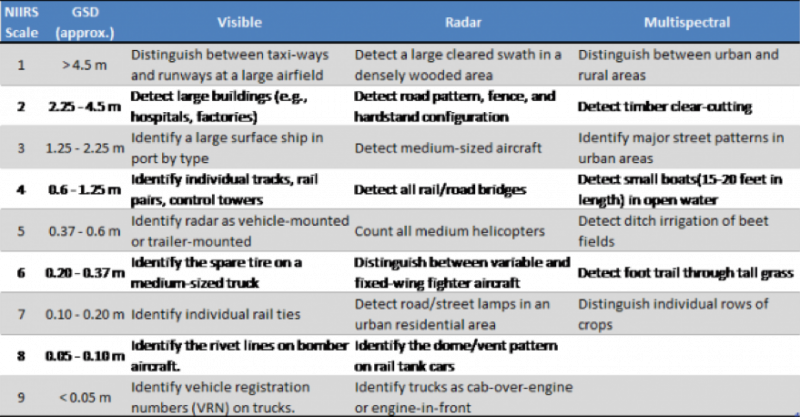
**Figure 14:** Excerpt of NIIRS scale related to GSD (Source: [http://fas.org/irp/imint/niirs.htm](http://fas.org/irp/imint/niirs.htm))
### 2 Scene size
The size of the scene to be observed is another important parameter. Earth Observation sensors onboard satellites are characterised by their **swath width. **The swath of an instrument is the width of the strip on the ground it can image when the satellite orbits around the Earth. The swath depends on the features of the instrument and on the orbit of the satellite. Generally, the higher the spatial resolution, the lower the swath of the instrument. As an example, the very high-resolution (0.46 m) instrument onboard Worldview-2 has a 16.4 km swath, while Sentinel-2 can image strips 290 km wide with a 5 m spatial resolution.
To cover large areas, VHR imagery requires a large number of images, which has an impact on the data volume to be managed and on the acquisition cost. Therefore, a **trade-off analysis between resolution and cost **needs to be performed before ordering satellite images.
Most EO product providers offer online graphical interface tools to select the area of interest, choose the EO products and the satellite system, and request archive images or task new acquisitions. Satellite operators will then generate the operation plan of the satellite based on optimised number of strips, satellite passes, area of interest, etc to satisfy the request and provide a price quotation.
Operators generally require a minimum area to be ordered (typically 100 square kilometres for VHR imagery).
### **3 Revisit time**
The need for Earth Observation data can be **"punctual"** (e.g. preparing a road maintenance operation in a remote area), **"punctual & urgent"** (e.g. assessing flooded areas after a tsunami) or **"periodic"** (e.g. monitoring crops). The revisit time of a satellite system (i.e. the time elapsed between subsequent observations of the same area of interest) is a decisive factor of choice. This parameter is closely linked to the type of orbit of the satellites.
Most EO satellites are in specific low Earth polar orbits called **"Sun-Synchronous Orbits (SSO)"**, whose altitude and inclination are precisely calculated so that the satellite will observe, over time, the same scene with the same angle of illumination coming from the Sun. This kind of orbit typically has an altitude of around 700 km and an inclination of 98˚. Due to this high inclination, the revisit time for a satellite will be longer for equatorial areas than for polar regions.
Two different definitions can be given to the revisit time. From the point of view of the satellite, the revisit time is the elapsed time before the satellite retraces its path, passing over the same exact point on the ground surface. From the point of view of an EO user, the revisit time is defined as the length of time to wait for the satellite system to be able to observe the same point on Earth.
The difference between these two definitions originates from the **"agility"** feature of most EO satellites, i.e. the ability of a satellite to modify its attitude in order to observe scenes outside its ground trace (see Figure 15 for different acquisition strategies). To further reduce the revisit time, EO constellations can be used: augmenting the number of satellites in orbit lowers the waiting time between observations of a same scene.

**Figure 15:** Different acquisition strategies using the agility of an EO satellite (Source: [http://www.cscrs.itu.edu.tr/assets/downloads/PleiadesUserGuide.pdf](http://www.cscrs.itu.edu.tr/assets/downloads/PleiadesUserGuide.pdf))
As an example, the two Pléiades constellation satellites on a SSO are able to acquire images in a +/- 30˚ corridor around their ground trace: while the periodic cycle of their orbits is 26 days, the agility of the satellites combined with the phased orbit of the constellation offer a 2 day revisit for any point on Earth.
It is worth noting that some EO satellites are in Geostationary Earth Orbits (GEO). At an altitude of approximately 36,000 km above the equator, they have an orbital period equal to the Earth’s rotational period (one day), which allows them to constantly observe the same portion of the Earth’s surface. Seen from ground observers they occupy a fixed position in the sky. The revisit time is therefore effectively zero. Meteosat satellites are able to scan the full earth disc every 15 minutes. The resolution of these images are, however, typically much lower than for SSO satellites due to the very high altitude of the GEO.
In practice, when ordering the acquisition of new images from an EO satellite, a feasibility assessment is conducted to estimate the turn-around time. Some areas can have a high demand for imagery (important backlog) or persistent cloud cover, which can prolong the effective revisit time.
### 4 Other image quality-related parameters
The quality and usefulness of an EO image is governed by several parameters.
**Bit depth**
When an instrument is imaging an area, each pixel is coded on a certain number of bits (typically from 8 to 16 bits) per band. In practice, this relates to the number of nuances that can be recorded: an 8-bit instrument will make the distinction between 28=256 colours whereas a 12-bit instrument will measure the intensity according to a scale of 212=4,096 nuances. Improved bit depth, also called radiometric resolution, aids the ability to discern detail in an image’s brightest and darkest (shadow) areas.
**Off-nadir angle**
In practice, very high-resolution satellite sensors generally do not collect images at nadir, i.e. looking straight down at the target, but acquire images at an angle. Satellite operators report this as the "off-nadir angle" where 0 degrees would be looking straight down. For optical imagery, a typical maximum is an off-nadir angle of 30 degrees.
| |
|---|
||
|**Figure 16:** Illustration of the building-lean effect (Source: [http://www.nrcan.gc.ca/earth-sciences/geomatics/satellite-imagery-air-p…](http://www.nrcan.gc.ca/earth-sciences/geomatics/satellite-imagery-air-photos/satellite-imagery-products/educational-resources/9401))|
A lower off-nadir angle often is desirable, especially in areas of high relief or tall buildings to minimize the so-called "building-lean" effect (see Figure 16). This problem is inherent in remote sensing, as we attempt to accurately represent the three-dimensional surface of the Earth as a two-dimensional image. Objects directly below the centre of the camera lens (i.e. at the nadir) will have only their tops visible, while all other objects will appear to lean away from the centre of the photo such that their tops and sides are visible. If the objects are tall, are far away from the centre of the photo, or if the off-nadir angle is large, the distortion and positional error will be larger.
**Sun-elevation angle**
Another parameter to take into account is the angle of the sun above the horizon. Imagery collected with low sun elevation angles may contain data that are too dark to be usable. This will be more pronounced in high-relief areas and areas with taller objects, such as trees and buildings, where low sun elevation angles mean longer shadows will be cast. A typical minimum Sun elevation angle is 30 degrees.
Due to the fact that most EO satellites are in Sun-Synchronous Orbits, there is little control over the time of day an area of interest is imaged. This is typically set to around 10:30 AM for optical imagery, or 6:00 AM for active imagery (dawn-dusk orbits).
**Cloud cover**
Optical imagery will be perturbed by the presence of clouds above the area of interest. When buying archived imagery, operators provide a reduced-resolution preview graphic ("quicklook") to check if no clouds are concealing the area of interest on the image before purchasing it. When ordering new observation tasking, the customer can ask for a maximum percentage of cloud cover. Customers receive an estimated time window for the acquisition, which maximises the [[probability]] of obtaining a cloud-free image. If the observation is unsuccessful, satellite operators can propose another time-window or the acceptance of the acquired images.